Amazon Tutorials

How to Build an Amazon Sales Tracker in Google Sheets

Last updated -
May 8, 2026

Article Summary

✅ An Amazon sales tracker in Google Sheets survives long term when raw data, dashboard logic, and the presentation view are separated into three distinct tabs from the start

✅ Gorilla ROI loads structured Amazon sales data directly into Google Sheets through a point-and-click interface, replacing the manual export and paste routine with an automatic data load that runs in seconds.


✅ The tracker breaks when data and dashboard formulas share the same tab: a new data load overwrites cell references and forces a rebuild.

Dashboard sales fba spreadsheet

I have a graveyard of abandoned Amazon spreadsheets. I have built at least six trackers since 2012, and the same thing killed each of them: the update became harder than the review.

The first version starts clean. Daily sales by SKU, color coded, organized. Six weeks later the data tab has 14 columns pasted in the wrong order, two references are broken, and whoever is responsible for updates has no idea which row matters.

Twelve years of selling on Amazon means twelve years of rebuilding broken spreadsheets. The three-tab structure came from counting how many times the handoff killed the file.

The third person to touch the file broke it. By then, two people before them had already stopped trusting it.

Why Amazon Sales Trackers Stop Getting Updated

An Amazon sales tracker fails in three specific ways before the data quality even becomes the problem.

| Root Cause | What Happens | Financial Cost | |---|---|---| | Data and dashboard references share the same tab | A new data load overwrites cells the dashboard was pointing to. The review block becomes a repair session. | 30 to 60 minutes of rebuild per incident, compounding as catalog size grows. | | One person owns the manual export routine | When that person is sick, on leave, or exits the business, the tracker stops updating and sales reviews stop. | A 3-day gap during a promotional window costs $600 to $1,200 in emergency reorder freight. | | The tracker covers too many jobs in one view | Daily sales, monthly P&L, inventory, and ads mixed into one tab becomes too fragile to update and too cluttered to read. | The team stops trusting the file and reverts to Seller Central logins for every check, adding 20 to 30 minutes per review. |

The Handoff Is Where Trackers Die

The data is rarely the problem. Every founder who has rebuilt the same tracker three times already knows the column names were right and the structure looked correct.

The structure was not built for a handoff. The moment a VA, manager, or second person touched the file, the references broke.

A three-tab structure fixes this. Each tab has exactly one job: receive raw data, run dashboard logic, or present the output. Those three layers never share a tab.

Three Tabs: One Job Each

A working Amazon sales tracker in Google Sheets runs on three tabs: PRODUCT_DETAILS, SALES_DATA, and DASHBOARD. Each tab has a single purpose and no crossover.

PRODUCT_DETAILS stores the master product list: seller_sku, asin, fnsku, and product_title for every active product. This is the reference tab every dashboard calculation points to. No sales data lives here. No charts. Facts only.

SALES_DATA is where Gorilla ROI loads your Amazon data. This tab receives the structured rows directly: one row per SKU per period, with consistent column names every load. Your team never pastes here manually. No merged cells, no color formatting, no dashboard references. This tab is the database.

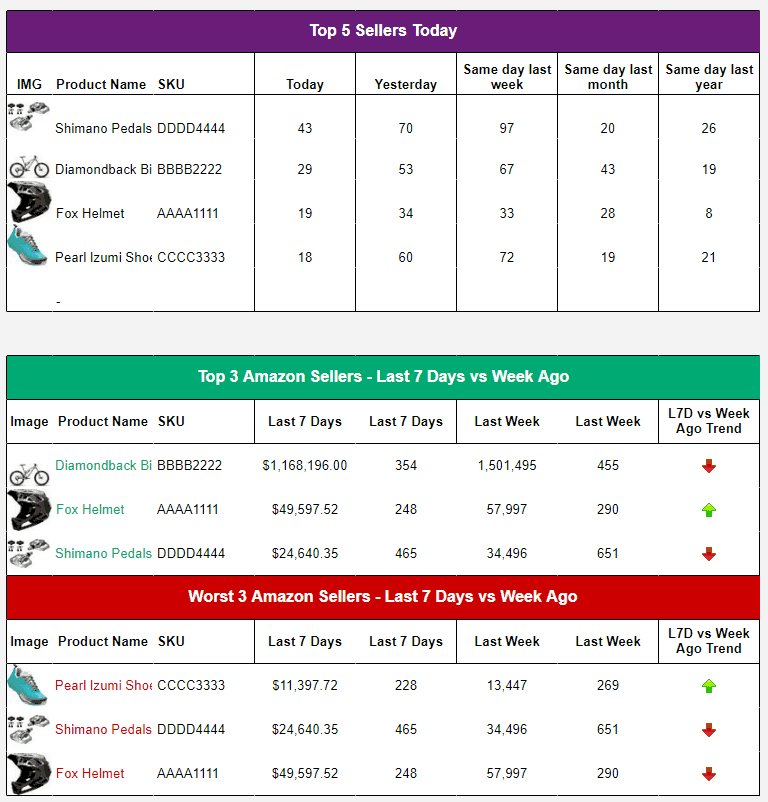
DASHBOARD presents the output. Charts, KPI summaries, period comparisons. This tab reads from SALES_DATA and PRODUCT_DETAILS using QUERY(), VLOOKUP(), or SUMIF(). No raw data lives here. The dashboard updates automatically when Gorilla ROI loads fresh data into SALES_DATA.

Keep the three tabs separated even if the catalog is small. The structure that handles 10 SKUs cleanly handles 200 SKUs without a rebuild.

What Gorilla ROI Loads Into the Tracker

Gorilla ROI connects to your Amazon Seller Central account through a point-and-click interface and loads structured sales data directly into Google Sheets. No formulas required to pull the data. No CSV exports. No column cleanup.

The data lands in SALES_DATA in a consistent structure every time. Large pulls, including 20,000+ rows of order or sales history, complete in seconds. The column names stay the same load to load, which means your DASHBOARD references never break.

The columns that land in your SALES_DATA tab for sales tracking:

| Column Name | What It Contains | |---|---| | date | The sales date for the row | | seller_sku | The SKU used in Seller Central | | asin | The Amazon catalog identifier | | product_title | Readable product name | | units_ordered | Units sold during the period | | ordered_product_sales | Revenue value for the period | | sessions | Product detail page visits | | unit_session_percentage | Conversion rate from sessions | | buy_box_percentage | Share of views where your offer held the Buy Box | | available_inventory | Units available for sale | | days_of_supply | Estimated days of stock remaining at current pace |

Your DASHBOARD tab reads from these columns. Your PRODUCT_DETAILS tab provides the SKU and ASIN reference. Gorilla ROI keeps SALES_DATA current. Your team reads the DASHBOARD.

For teams who want to go deeper, Gorilla ROI includes an optional formula-based reporting layer. This is for advanced users who want custom calculations, cross-tab lookups, or granular period controls beyond the standard data load. The point-and-click connector works without it.

One trade-off worth flagging: set up the three-tab structure and confirm your column headers before the first data load. Reorganizing a tab after data has already landed means rebuilding the DASHBOARD references that point to it.

When the Sheet Survives the Handoff and When It Does Not

The tracker does not break because the data is wrong. It breaks because the person updating it does not know which tab is fragile, which formula must not be touched, and which export needs cleanup before it gets pasted.

| Situation | Sheet That Breaks | Sheet Built to Survive | |---|---|---| | Second person updates the data tab | Pastes new export over existing formulas. Dashboard references break. Rebuild required. | Gorilla ROI loads into SALES_DATA. DASHBOARD references stay intact because column structure never changes. | | Owner exits the business | Nobody knows which tab is fragile or which formula must never be touched. Sheet stops being updated within a week. | Any team member triggers a new data load from the sidebar. Structure requires no explanation. | | Catalog grows from 20 to 100 SKUs | New SKUs require new rows, formula extensions, and chart reconfigurations. One wrong paste breaks the sheet. | New SKUs load into PRODUCT_DETAILS automatically. SALES_DATA expands with the load. Dashboard reads new rows without manual reconfiguration. | | Review period changes | Date filters adjusted manually across every tab. Inconsistent date ranges produce mismatched totals. | Date range set once in the Gorilla ROI sidebar. All tabs update from the same load. |

For teams reviewing sales alongside inventory and reorder signals, connect the SALES_DATA tab to an Amazon inventory forecasting workflow so units ordered and days of supply are visible in the same data layer.

For the specific columns your daily sales view should include, see the Amazon sales snapshot spreadsheet guide.

Key Terms

| Term | Definition | |---|---| | Google Sheets data hub | A Google Sheets data hub connects to Amazon, Shopify, and Walmart through an API and loads structured selling data directly into a spreadsheet. It matters because the team works from data that is already in the file, without logging into Seller Central to pull reports manually. | | Data-Logic-Presentation structure | A three-tab spreadsheet architecture where raw data, dashboard calculations, and visual output each live on a separate tab. It matters because mixing data and dashboard references in one tab means a new data load can overwrite cell references and require a full rebuild. | | Point-and-click data load | A point-and-click data load delivers structured Amazon data into Google Sheets without formulas or developer work. The user selects the report type and date range in the Gorilla ROI interface, and the rows land in the designated sheet tab in a consistent column structure. |

FAQ

| Question | Answer | |---|---| | How do I create an Amazon sales tracker in Google Sheets? | Build three separate tabs: PRODUCT_DETAILS for your SKU and ASIN master list, SALES_DATA to receive data loaded by Gorilla ROI, and DASHBOARD for charts and KPI output. Connect Gorilla ROI to your Amazon account, load your sales data into SALES_DATA, and build your dashboard references on top of the consistent column structure. | | Does Gorilla ROI require formulas to pull Amazon sales data? | Gorilla ROI pulls Amazon sales data into Google Sheets through a point-and-click interface. No formulas are required. Data loads directly into your designated tab in a structured format. An optional formula layer is available for advanced users who want custom calculations, period controls, or cross-tab lookups on top of the loaded data. | | How long does it take Gorilla ROI to load sales data into Google Sheets? | Large pulls including 20,000+ rows of sales history complete in seconds. The load time depends on the report type, date range, and account size. For daily tracker updates, the typical load completes in under 2 minutes including verification. | | How many tabs should an Amazon sales tracker have? | Three at minimum: one to receive raw data, one for dashboard logic, and one for the presentation view. Separating the three layers means a new data load into SALES_DATA does not break the references in DASHBOARD. Add additional data tabs as tracking needs grow, one tab per data type. | | What is the difference between an Amazon sales tracker and a sales snapshot? | A sales tracker records how performance changes over time by SKU, period, and channel. A sales snapshot shows today's position: units ordered, available inventory, and days of supply right now. The snapshot is the daily check-in. The tracker is the historical record the snapshot feeds into. See the Amazon sales snapshot guide at gorillaroi.com/blog/amazon-sales-snapshot-spreadsheet for the daily view columns. | | How do I stop the tracker from breaking when someone else updates it? | Separate data from dashboard references into different tabs. The person doing the update triggers the Gorilla ROI load into SALES_DATA only. DASHBOARD requires no manual input and updates automatically when SALES_DATA changes. When anyone can load new data without touching the dashboard tab, the tracker survives the handoff. | | Can I use Gorilla ROI for Amazon, Shopify, and Walmart data in the same tracker? | Gorilla ROI loads Amazon, Shopify, and Walmart data into Google Sheets through the same interface. Each data type loads into its own designated tab. Your DASHBOARD tab can reference all three using QUERY() or SUMIF() to build a combined channel view. See gorillaroi.com/integrations for the full list of supported channels. |

Amazon Sales Tracker Build Checklist

Drop this into Slack before handing the tracker to a VA or manager.

PRODUCT_DETAILS Tab

  • One row per active seller_sku
  • Columns: seller_sku, asin, fnsku, product_title
  • Populated via Gorilla ROI product data load
  • No sales output calculations in this tab

SALES_DATA Tab

  • Designated as the target tab for Gorilla ROI data loads
  • Column headers match the Gorilla ROI output structure exactly
  • No charts, merged cells, or color formatting in this tab
  • No manual paste ever happens in this tab

DASHBOARD Tab

  • All data pulled from SALES_DATA and PRODUCT_DETAILS using QUERY(), VLOOKUP(), or SUMIF()
  • No raw data stored directly in this tab
  • Period comparison covers at minimum: last 7 days, last 30 days, current month, prior month

Before Handing Off

  • A team member who did not build the tracker can trigger a Gorilla ROI load without breaking DASHBOARD
  • SALES_DATA column structure confirmed before first load
  • No tab contains raw data and dashboard charts at the same time

Leave a Reply

Thank you! Your submission has been received!
Oops! Something went wrong while submitting the form.

Manual Exports Don’t Scale Forever

Replace Manual Spreadsheet Workflows Before They Slow Your Team Down