.svg "Gorilla ROI")

Article Summary
✅ Amazon Brand Analytics gives eligible brand owners aggregate data across search behavior, catalog performance, market basket patterns, repeat purchase behavior, demographics, and customer loyalty.
✅ Brand Analytics tells you what shoppers searched, clicked, added, bought, paired, and repeated. It does not tell you whether the product had stock, margin, ad efficiency, or retained revenue.
✅ Gorilla ROI does not replace Brand Analytics or pull every Brand Analytics report directly. Use Brand Analytics for Amazon’s brand-side signals, then use Google Sheets operating data to decide whether the signal is worth acting on.
Amazon Brand Analytics (ABA) helps brand owners see customer behavior that standard order reports cannot show.
Your Search Query Performance report can show purchases for a query, while your settlement data tells a different cash story.
That gap matters because Brand Analytics data is built for understanding shopper behavior. It is not built to answer margin, payout, inventory, or return questions by itself.
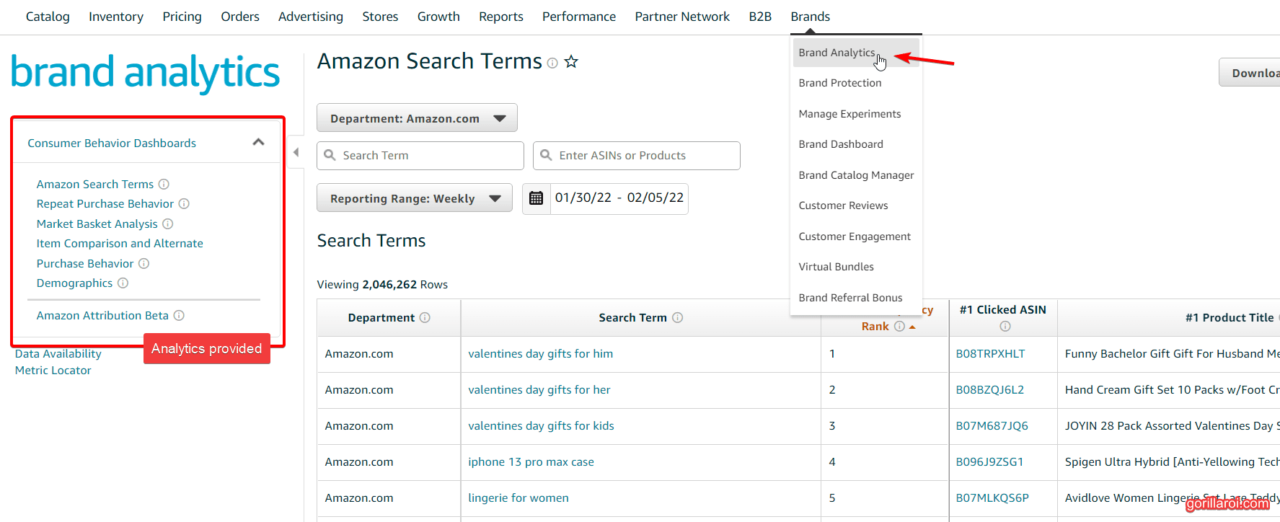
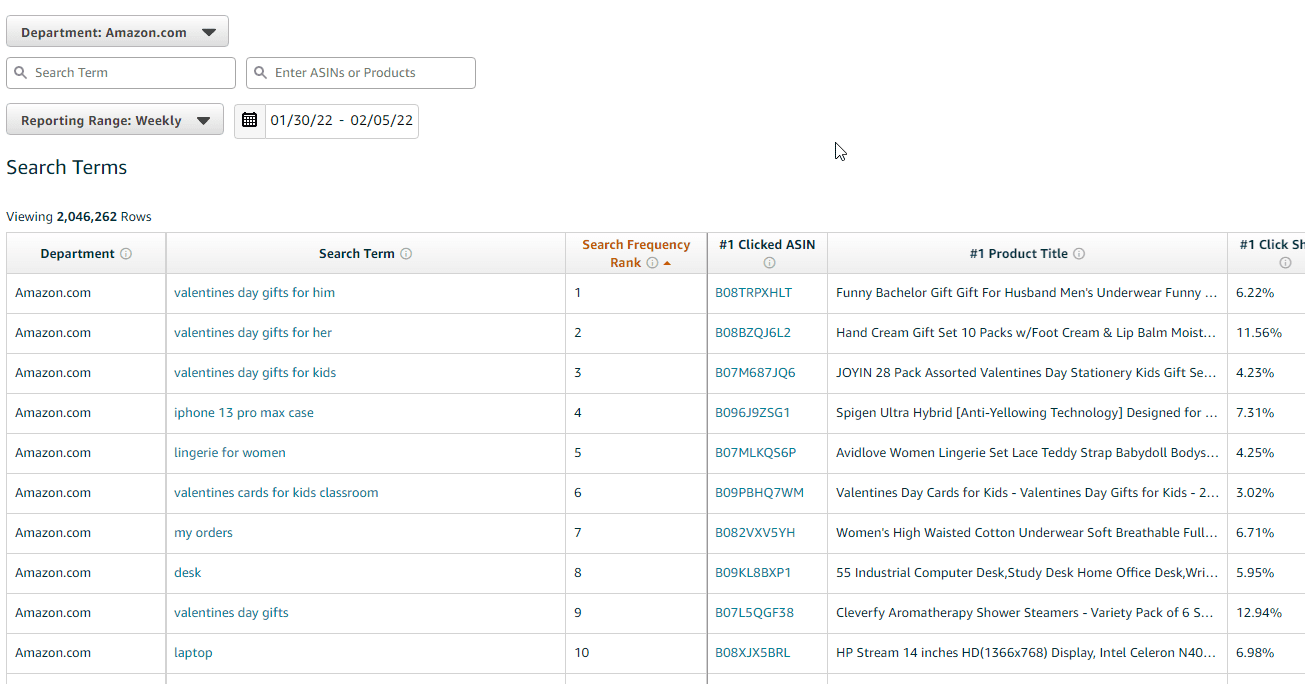
Amazon says Brand Analytics gives Brand Registry sellers access to aggregated customer search and purchase data, including dashboards for search, customer behavior, repeat purchase behavior, demographics, top search terms, market basket, Search Catalog Performance, and Search Query Performance. Amazon Brand Analytics overview explains the main report set and access through Brand Registry.
So I would use Brand Analytics as the signal layer.
You see which queries matter, which ASINs lose shoppers in search, which products get bought together, and which products bring customers back. Then you check your operating data before making a listing, ad, inventory, or pricing decision.
That is where a lot of teams get into trouble. They find an interesting signal inside Brand Analytics and act before checking stock, ad spend, margin, returns, or payout data.
Brand Analytics is currently only available to Brand Registered Sellers. You access it by going to Seller Central > Reports > Brand Analytics.
Brand Analytics reports answer separate questions
Brand Analytics works better when each report has its own job in your workflow.
I would not dump every export into one tab. SQP, Search Catalog Performance, Market Basket, Repeat Purchase, and Demographics all use different row structures. If you force them into one worksheet, your formulas spend half their life untangling a problem you created.
Amazon added SP-API report types for Search Query Performance and Search Catalog Performance in February 2025. The SP-API changelog says Search Catalog Performance provides search engagement metrics such as impressions, clicks, cart adds, and purchases for a date range, while Search Query Performance provides query performance for a given ASIN and date range.
That API update matters, but do not overread it. It does not mean every Brand Analytics report becomes an automatic Google Sheets feed for every seller. Treat API access report by report.
Search Query Performance shows where the search funnel narrows
Search Query Performance is the report I would check first when a search term looks important but the sales result does not make sense.
Amazon’s analytics report documentation says Search Query Performance provides query performance data such as impressions, clicks, cart adds, and purchases for specified ASINs and date ranges. It also notes data is available by WEEK, MONTH, and QUARTER, and requests cannot span multiple periods.
Here is the plain version:
- Impressions show whether your ASIN had a chance to be seen.
- Clicks show whether shoppers chose your result.
- Cart adds show whether the product made it into serious consideration.
- Purchases show whether shoppers finished the order.
That sequence matters.
If impressions are there and clicks are weak, I would look at what shoppers see before they click: title, main image, rating, review count, coupon, price, and offer position.
If clicks are there and purchases are weak, I would look at what happens after the click: product fit, images, price, reviews, variation setup, delivery promise, and whether the listing matches the query.
That is data interpretation. The actual listing changes belong in your listing workflow. If you need that execution path, use the Amazon listing optimization checklist.
Search Catalog Performance shows which ASINs need a closer look
Search Catalog Performance gives you a product-level view of how your ASINs move through Amazon search.
I would use it when the question is about the product, not one search term.
For example:
- An ASIN gets impressions but earns weak clicks.
- An ASIN earns clicks but gets weak cart adds.
- An ASIN gets cart adds but weak purchases.
- An ASIN has strong search engagement but weak retained sales in your operating data.
Think of SQP as the query view and Search Catalog Performance as the ASIN view. SQP tells you which doorway shoppers came through. Search Catalog Performance tells you what happened to the product once shoppers saw it in search.
This is where the report becomes useful beside your normal Google Sheets data.
If the ASIN looks strong in Search Catalog Performance but your sales tracker is flat, I would compare it against your Amazon sales tracker in Google Sheets. If search behavior looks healthy but the product is not making money, I would check settlement, fee, return, and ad data before touching the listing.
Market Basket and Repeat Purchase need business context
Market Basket and Repeat Purchase reports show useful patterns, but they are easy to misread without margin and inventory data.
Market Basket Analysis shows products customers buy together. Repeat Purchase Behavior shows whether customers come back for the product again. Both can point to good ideas, but neither report tells you whether the idea is worth acting on.
A basket pair may look like a bundle opportunity until you check margin and realize the discount kills the economics.
A repeat purchase pattern may look like a loyalty opportunity until you check inventory and supplier lead time and realize you cannot support the demand.
I would use these reports to ask better questions:
- Is the paired product complementary or just commonly purchased?
- Does the pair reveal a use case we should understand?
- Does repeat purchase behavior line up with actual retained revenue?
- Can inventory support a push on this ASIN?
- Does the margin justify any promotion, bundle, or content change?
Brand Analytics shows the pattern. Your operating data decides whether the pattern deserves action.
Brand Analytics belongs beside sales, ads, inventory, returns, and fees
Brand Analytics gets stronger when the signal sits next to your operating data in Google Sheets.
A query with strong purchase share means less if the product is low margin, out of stock, refund-heavy, or propped up by ad spend. A product with weak click share may need a listing review, but I would still check price, Buy Box, ad traffic, and reviews before deciding what changed.
Here is the workbook structure I would use:
This is the part I would not skip: keep Brand Analytics exports close to the data your team already uses.
If SQP lives in one file and sales, ads, returns, and inventory live somewhere else, the report gets checked once and forgotten. If the Brand Analytics tabs sit beside operating data, your team can compare the signal before acting.
For the larger workbook structure, use the Amazon seller data to Google Sheets guide. For ad-side fields like ACoS, ROAS, TACoS, clicks, and impressions, use the Amazon advertising metrics guide. For order-level context, use the Amazon order data to spreadsheet article.
Where Gorilla ROI fits beside Brand Analytics

Gorilla ROI fits beside Brand Analytics by keeping the operating data current in Google Sheets.
I would not position Gorilla ROI as a Brand Analytics replacement. Brand Analytics is Amazon’s brand-side search and customer behavior view. Gorilla ROI is the Google Sheets data hub for ecommerce operations.
For this workflow, the clean setup is simple:
- Export or access the Brand Analytics report you need.
- Land each Brand Analytics report in its own tab.
- Use Gorilla ROI to keep sales, orders, inventory, advertising, fees, and returns current in the same workbook.
- Compare the Brand Analytics signal against the operating data before making a listing decision.
That last step is where the value is.
If SQP says a query is getting purchases, I still want to see retained sales, ad spend, returns, stock position, and margin. If Market Basket suggests a product relationship, I still want to see whether the economics work.
Kyle, co-founder of an 8-figure brand running Amazon, Shopify, and Walmart, said, “Gorilla ROI really is the cornerstone for data and decisions for our business. And we wouldn't be able to operate without it.”
That is the correct role here: not replacing Brand Analytics, but making sure the rest of the business data is current when your team reads Brand Analytics.
Brand Analytics can point to listing decisions, but it should not make them alone
Brand Analytics should guide where your team investigates. It should not be the final answer for money, inventory, or execution.
Here is the line I would draw:
- Use Brand Analytics to find the query, ASIN, basket pair, repeat purchase signal, or customer pattern worth reviewing.
- Use Google Sheets operating data to check sales, ad spend, inventory, returns, fees, and margin.
- Use Seller Central for catalog, listing, and brand changes.
- Use Amazon Ads or your PPC tool for campaign work.
- Use settlement and fee data for profit and cash decisions.
If your question is “which query should I investigate,” Brand Analytics is useful.
If your question is “did this product make money after ads, returns, and fees,” Brand Analytics is not enough.
That is the failure I would watch for: turning a search behavior report into a business decision before checking the business data.
Gorilla ROI is the wrong choice for Brand Analytics-only work
Gorilla ROI is the wrong tool if your only workflow is opening Brand Analytics once a month and checking a few search terms.
Keep the manual Brand Analytics process if:
- You have a small catalog.
- One person owns listing review.
- You check Brand Analytics monthly.
- Your team does not use Google Sheets as a working file.
- You only need Amazon’s native Brand Analytics screens.
Use Gorilla ROI when your team already works in Google Sheets and needs current Amazon sales, order, inventory, advertising, fee, return, and product data beside the Brand Analytics signal.
If Brand Analytics is a monthly research screen, keep it simple. If the sheet is where your team makes decisions, keep the operating data current there.
Brand Analytics checklist for a cleaner workbook
Use this before your team starts copying Brand Analytics exports into a shared file.
- Create one tab per Brand Analytics report. Start with
BA_SEARCH_QUERY,BA_SEARCH_CATALOG,BA_MARKET_BASKET, andBA_REPEAT_PURCHASE. - Add the reporting period to every import. SQP data can be weekly, monthly, or quarterly, and mixing periods breaks trend logic.
- Keep Brand Analytics raw tabs separate from sales, ads, returns, and settlement tabs.
- Build joins in a calculation tab using ASIN, date range, and marketplace where available.
- Add a
LISTING_DECISIONStab so the team records the signal, supporting data, owner, and next action. - Check inventory before acting on a strong SQP signal.
- Check margin before acting on a Market Basket idea.
- Check returns before acting on a query that brings purchases but weak retained sales.
Amazon Brand Analytics FAQ
What is Amazon Brand Analytics?
Amazon Brand Analytics is a set of aggregate reporting views in Seller Central for eligible brand owners. It helps you understand customer search behavior, catalog performance, basket patterns, repeat purchase behavior, demographics, and customer loyalty.
Who can access Amazon Brand Analytics?
Amazon says Brand Analytics is available to eligible brands enrolled in Amazon Brand Registry. Access can depend on marketplace, account permissions, and brand role.
What reports are included in Amazon Brand Analytics?
Brand Analytics can include Search Query Performance, Search Catalog Performance, Top Search Terms, Market Basket Analysis, Repeat Purchase Behavior, Demographics, Customer Loyalty Analytics, and related customer or brand behavior views. Availability can vary by account and marketplace.
What is Search Query Performance?
Search Query Performance shows query-level funnel data such as impressions, clicks, cart adds, and purchases for a given ASIN and reporting period. Use it to see where a search term gains or loses shoppers before deciding whether the listing needs closer review.
What is Search Catalog Performance?
Search Catalog Performance shows search engagement metrics at the product level. Use it to see which ASINs get seen, clicked, added to cart, or purchased, then compare that signal against sales, ads, returns, inventory, and margin data.
Does Gorilla ROI pull Brand Analytics data into Google Sheets?
Gorilla ROI should not be treated as a Brand Analytics replacement. Use Brand Analytics for Amazon’s brand-side search and customer behavior data. Use Gorilla ROI to keep operating data current in Google Sheets so your team can compare Brand Analytics signals against sales, inventory, ads, orders, returns, and fees.
Should I use Brand Analytics for listing optimization?
Use Brand Analytics to decide which queries, ASINs, and shopper behavior patterns deserve review. The actual listing work belongs in a listing workflow, not this data article. For that, use the Amazon listing optimization checklist.